Role & Background
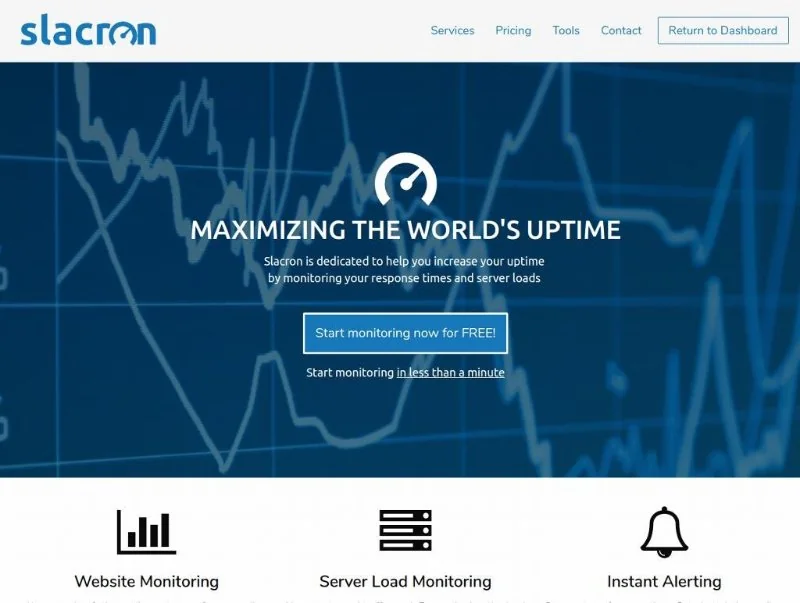
Co-founded a Canadian technology startup developing a distributed monitoring platform for business-critical websites and servers.
- Architected and developed the technical platform for monitoring server load, availability and response times across distributed locations.
- Built automated reporting and email/SMS incident-alerting capabilities.
- Developed the backend in a LAMP environment and managed production, development and remote monitoring infrastructure.
Architecture
A central LAMP application coordinating distributed monitoring nodes
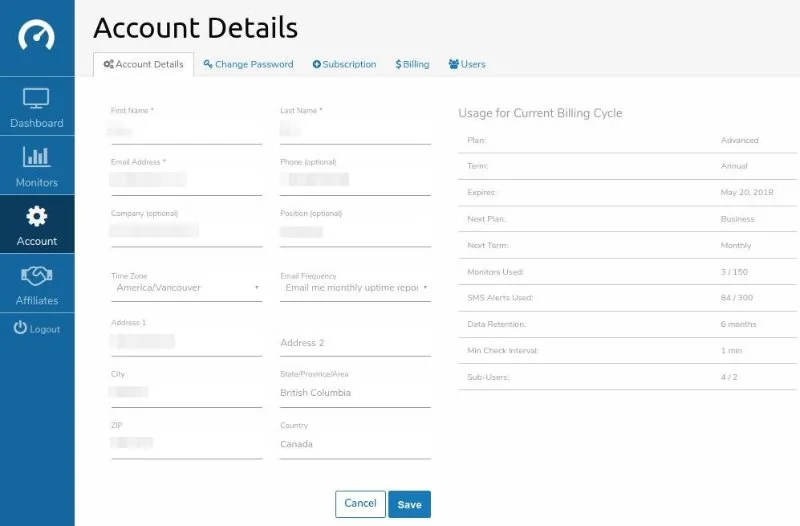
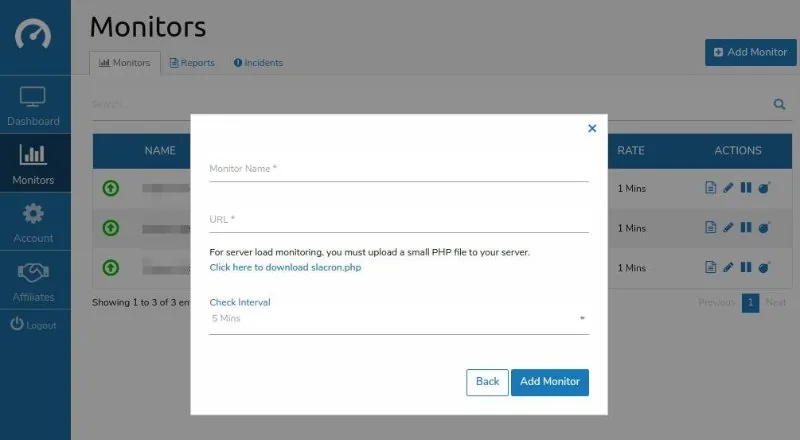
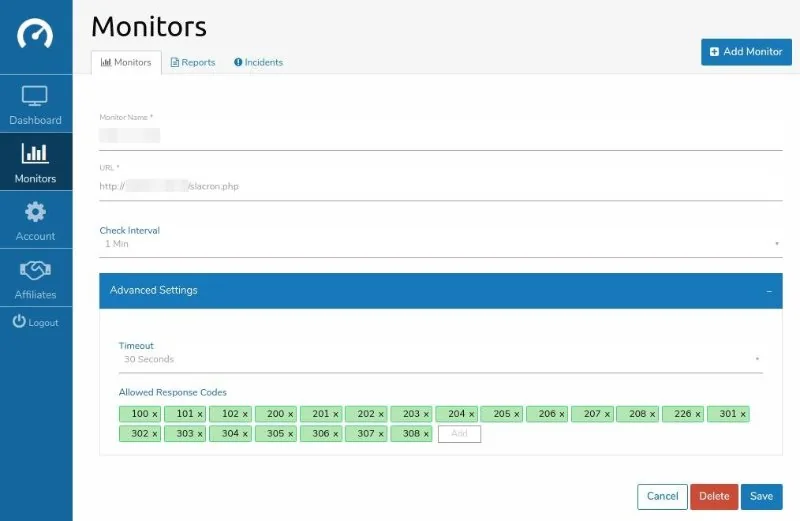
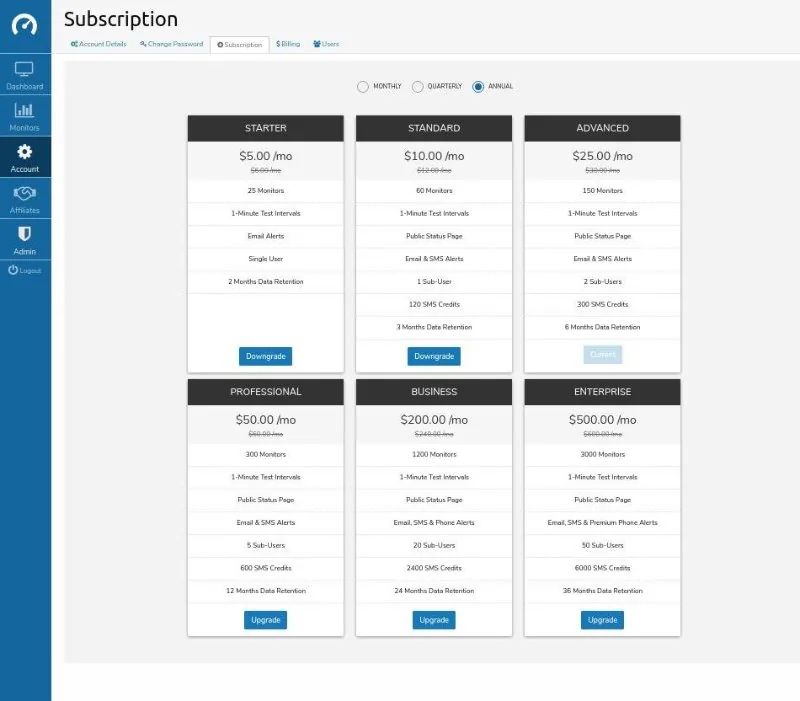
Slacron used a central LAMP server for the public website and the authenticated application dashboard. The application maintained user accounts, subscriptions, monitor definitions, reporting data, alert preferences and the configuration needed to coordinate checks across remote monitoring servers.
A scheduler ran every minute, selected monitors that were due according to each customer’s interval, checked whether results had already arrived and dispatched outstanding jobs to monitoring nodes in several geographic regions.
Distributed Checks
Testing availability and response from multiple regions
Remote monitoring nodes ran the same worker code. For ordinary availability checks they made cURL requests to the configured URL, port or service, captured response timing, HTTP status and relevant response content, and returned the result to a callback endpoint on the central application.
Running the same checks from multiple regions helped distinguish a genuinely unavailable service from a routing, connectivity or regional-access problem and made geographic response-time differences visible in the reports.
Server Telemetry
Optional server-load, CPU, memory and disk monitoring
For customers who wanted deeper server telemetry, a lightweight PHP component could be installed on the monitored server. Monitoring nodes could then retrieve values such as server load, CPU and memory utilization and available disk space in addition to external availability measurements.
The design kept the customer-facing configuration in the central application while allowing the distributed nodes to perform work close to the regions being measured.
Incidents & Reporting
Turning minute-by-minute checks into useful operational evidence
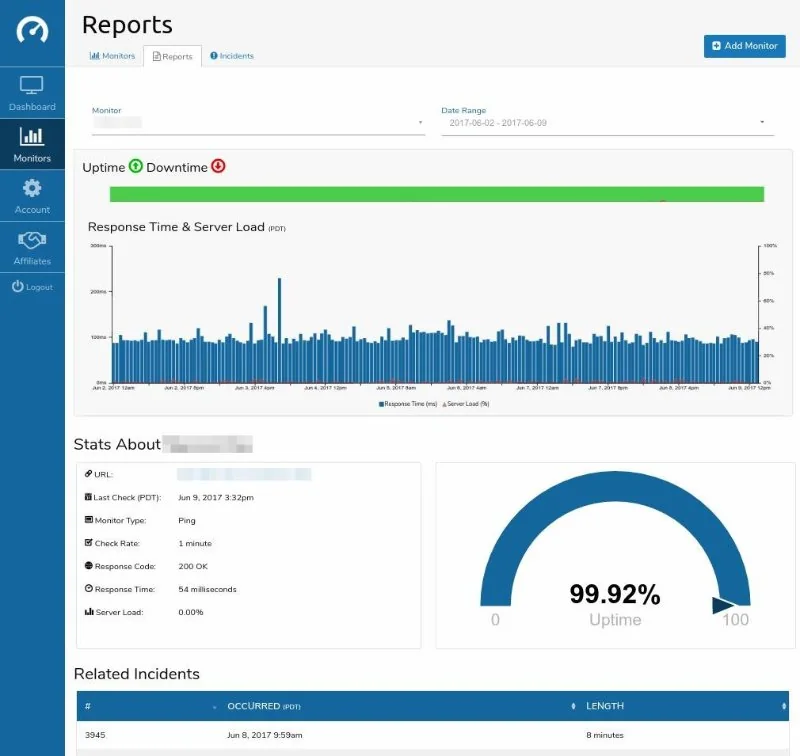
Returned results were processed by background jobs on the central server to make historical reporting efficient. When a monitor crossed a configured failure condition — for example a non-200 HTTP response — the application could send email and/or SMS notifications and link recipients to an incident report.
Accounts could contain multiple users with per-incident notification preferences. Many customers were IT professionals who used the reports both for immediate response and as evidence when documenting ISP outages, SLA issues or service interruptions for management.
Portfolio Media
Selected media
Screenshots and photos from this work. Select an image to view it at a larger size.