WordPress and WooCommerce sites often become slower gradually rather than failing all at once.
A store that performed perfectly well with a few hundred products, a handful of plugins and modest traffic may eventually accumulate thousands of products, years of orders, more integrations, larger databases, additional marketing tools and increasingly complicated customer workflows.
Nothing necessarily "breaks."
The site simply begins taking longer to do everything.
That is also why performance problems are often treated incorrectly. Someone notices that the site is slow and immediately installs another caching plugin, upgrades the server or starts removing plugins.
Any of those actions might help.
But they can also completely miss the real bottleneck.
The first question should not be:
How do I make this WordPress site faster?
It should be:
Where is the time actually being spent?
Once that question is answered, performance work becomes much more predictable.
Start by identifying the bottleneck
A web request passes through several layers before the visitor sees the completed page.
A simplified WordPress request might look like this:
Browser → CDN or Cloudflare → web server → PHP → WordPress → plugins/theme → database → external services → response
A delay introduced at any one of those layers can make the entire site feel slow.
That means a slow product page does not automatically mean WooCommerce is slow.
A slow server response does not automatically mean the server needs more CPU.
And a poor PageSpeed score does not necessarily mean PHP or MySQL is the problem.
The objective is to isolate the layer responsible for the delay.
Useful evidence can come from:
- browser developer tools
- server response times
- PHP execution time
- database query counts and query duration
- CPU utilization
- memory pressure
- disk I/O
- web server process utilization
- PHP worker saturation
- application and server logs
- third-party API timing
- CDN cache status
- real-user performance data
The important part is establishing a baseline before making changes.
Otherwise optimization quickly turns into guesswork.
Time to first byte tells only part of the story
Time to first byte, or TTFB, is one useful starting point because it can help separate backend delays from frontend rendering problems.
If the browser waits several seconds before receiving the first byte of HTML, optimizing an image or minifying a stylesheet probably will not solve the main problem.
Something upstream is taking too long.
That could be PHP.
It could be MySQL.
It could be an external API.
It could be exhausted PHP or Apache workers.
It could even be a DNS or network problem.
On the other hand, if the server produces HTML very quickly but the page still takes several seconds to become usable, the investigation should move toward images, JavaScript, fonts, CSS, third-party scripts and browser rendering.
Performance should be divided into measurable components rather than treated as a single number.
Caching is not one thing
One of the most common sources of confusion in WordPress performance work is the word "cache."
There are several completely different caching layers, and improving one does not necessarily fix a problem in another.
Page caching
Page caching stores the completed HTML produced by WordPress.
Instead of executing PHP and querying the database for every visitor, the server can sometimes return a previously generated page almost immediately.
For relatively static WordPress content, this can eliminate a large amount of application work.
WooCommerce makes this more complicated because parts of an ecommerce site are inherently dynamic.
Object caching
WordPress frequently retrieves the same application data repeatedly.
A persistent object cache can store frequently used objects and query results outside the database so they can be reused across requests.
Redis and Memcached are common technologies for this purpose.
Object caching does not replace page caching.
It reduces repeated application and database work when WordPress still needs to execute.
PHP OPcache
PHP normally needs to parse and compile PHP source code before executing it.
OPcache stores compiled PHP bytecode in shared memory so PHP does not have to repeat that work unnecessarily.
This is a completely different layer from WordPress page caching or Redis object caching.
A site can therefore have:
- excellent page caching
- no persistent object cache
- badly configured OPcache
or almost any other combination.
Browser and CDN caching
Browsers and CDNs can cache static resources such as:
- images
- CSS
- JavaScript
- fonts
- downloadable files
A service such as Cloudflare can also cache content at edge locations closer to visitors.
That can reduce latency and reduce the amount of traffic reaching the origin server.
But edge caching must understand which content is actually safe to cache.
That distinction becomes particularly important with WooCommerce.
WooCommerce changes the caching rules
An ordinary WordPress article can often be cached aggressively because every anonymous visitor receives essentially the same HTML.
An ecommerce store has more state.
WooCommerce needs to know things such as:
- what is in the customer's cart
- whether the customer is logged in
- which session belongs to the customer
- account information
- checkout state
- recently viewed products
- potentially personalized content
Pages such as Cart, Checkout and My Account must therefore remain dynamic.
WooCommerce also uses cookies and session information that caching systems need to respect.
This is why blindly applying a "Cache Everything" rule to an ecommerce site can be dangerous.
An incorrect caching configuration can create problems much more serious than a slow page.
Customers could receive stale content, broken carts, incorrect account behavior or content intended for a different application state.
Caching should reduce unnecessary computation without destroying the dynamic behavior the application requires.
Plugin count is not the useful metric
Another common performance rule says that a WordPress site has "too many plugins."
Plugin count by itself tells us very little.
Twenty small, efficiently written plugins may create less overhead than one plugin that performs expensive database queries, makes remote API calls or executes complicated logic on every request.
The more useful questions are:
- Which plugins execute during this request?
- How many database queries do they generate?
- How long do those queries take?
- Do they call external services?
- Do they load code on pages where it is unnecessary?
- Do they create scheduled background jobs?
- Do they add large amounts of autoloaded configuration?
- Do they generate expensive uncached computations?
This is where profiling becomes much more valuable than simply deactivating plugins at random.
Sometimes the problem really is a plugin.
But the objective is to identify which plugin, which operation and why.
The database often becomes more important as a store grows
WooCommerce stores accumulate data continuously.
Products, variations, orders, customers, metadata, sessions, scheduled actions, plugin settings, analytics and logs all contribute to database growth.
A database that was trivial when a store launched may eventually become one of the most important components of the site's performance.
Useful questions include:
- Which queries are taking the longest?
- Which queries execute most frequently?
- Are indexes being used effectively?
- How much data is being autoloaded by WordPress?
- Are expired transients or abandoned plugin data accumulating?
- Are background jobs creating unnecessary database activity?
- Is the database repeatedly reading frequently used data from disk?
- Does a persistent object cache make sense for the workload?
Database cleanup can help, but indiscriminately deleting rows is not database optimization.
The goal is to understand how the application uses the data.
MySQL needs memory too
For WordPress installations using InnoDB, one of the most important MySQL memory structures is the InnoDB buffer pool.
It caches table and index data in memory.
If frequently accessed data can remain in memory, MySQL can avoid repeatedly retrieving it from slower storage.
That does not mean assigning nearly all server memory to MySQL.
A server running Apache, PHP, MySQL and other services needs enough memory for all of them.
The correct MySQL configuration therefore depends heavily on the architecture.
A dedicated database server can allocate memory very differently from a small VPS where the database shares RAM with the web server and PHP processes.
This is why copying a "perfect MySQL configuration" from another server is rarely a good tuning strategy.
Performance settings need to fit the workload and the available hardware.
PHP OPcache should not be forgotten
WordPress and WooCommerce execute a large amount of PHP code.
Themes and plugins add even more.
OPcache allows PHP to retain compiled bytecode in shared memory rather than repeatedly compiling the same PHP files.
Important settings include things such as:
- whether OPcache is enabled
- available OPcache memory
- the number of PHP scripts it can cache
- wasted cache memory
- timestamp validation behavior
The appropriate configuration depends on the number and size of PHP files used by the application.
A large WooCommerce installation with many plugins can have very different requirements from a small brochure site.
Again, the important step is measurement.
Check whether OPcache is actually being exhausted or restarted before increasing values simply because a tuning guide recommends larger numbers.
Apache and PHP workers can become a hidden queue
A server can have plenty of CPU available and still respond slowly.
One reason is concurrency.
Apache can only process a certain number of simultaneous requests, depending on its configuration and Multi-Processing Module.
PHP processing has its own concurrency limits depending on how PHP is deployed.
If all available workers are busy, additional requests wait.
From the visitor's perspective, the website simply appears slow.
Increasing worker limits may solve that problem.
Or it may make the server much worse.
For example, with Apache's prefork model, additional worker processes consume additional memory.
Setting the maximum worker count higher than the machine can comfortably support can push the server into memory pressure or swapping.
At that point increasing concurrency actually reduces performance.
Worker sizing therefore requires knowing approximately how much memory processes consume under realistic load and how much RAM must remain available for MySQL, the operating system and other services.
Cloudflare can reduce origin work, but configuration matters
A CDN can do much more than simply distribute images.
Cloudflare can reduce latency, cache static resources and in some configurations serve cacheable HTML without sending every request to the origin server.
That can significantly reduce server load.
But WooCommerce requires careful cache rules.
Static resources are usually straightforward.
Dynamic HTML is not.
A sensible Cloudflare strategy starts by understanding:
- which requests are safe to cache
- which URLs must bypass cache
- which cookies indicate personalized state
- how query strings affect cache keys
- how and when cached content is purged
- appropriate browser and edge TTLs
The objective is not to achieve the highest possible cache-hit percentage.
The objective is to cache the right requests.
A lower cache-hit ratio with correct ecommerce behavior is far better than an impressive cache statistic accompanied by broken customer sessions.
What I currently use on my own LAMP + Cloudflare stack
There is no single optimization plugin that I consider universally best. On the WordPress and WooCommerce sites I currently run on my own LAMP + Cloudflare stack, I prefer a layered combination because it gives me control over different parts of the request rather than asking one plugin to make every decision.
My current free stack is:
- Super Page Cache for the page-cache and Cloudflare-aware caching layer
- Asset CleanUp: Page Speed Booster for controlling which CSS, JavaScript and other assets load where
- Debloat for additional CSS and JavaScript delivery optimization
That combination took trial and error to configure correctly. The plugins overlap in places, so enabling every optimization feature in every plugin is a good way to create conflicts. I divide responsibilities between them and then test the result as a logged-out visitor, on mobile and desktop, and through important WooCommerce flows.
If budget is available, either Super Page Cache Pro or Asset CleanUp Pro can reduce the need for such a three-plugin combination. In my experience, each paid version covers enough additional optimization territory that a simpler stack becomes possible. Which one makes more sense depends on whether the priority is the caching/CDN side or granular asset and plugin control.
I also keep diagnostic tools separate from permanent optimization tools. Query Monitor, for example, is valuable when I am looking for an active problem or fine-tuning a site, but I normally deactivate it when the investigation is finished and enable it again when needed.
Other technologies have been more conditional for me. Cloudflare APO has worked very well, but WooCommerce sites sometimes required additional tuning and exclusions. WP Rocket was easy to configure and generally effective, but I prefer deeper control. Redis delivered strong results initially, yet on servers hosting multiple WooCommerce installations I eventually encountered recurring isolation/reliability problems and removed it from my stack. Those Redis issues may have been specific to my configuration, so I treat that as an operational lesson rather than a blanket recommendation against Redis.
The larger point is that performance plugins should be selected as components of an architecture. Two tools that are excellent individually can become a bad combination if both try to rewrite, defer, cache or purge the same thing.
A real production example: bakasyon.ph
To make this less abstract, the screenshots below come from bakasyon.ph, a live WordPress site I operate on a LAMP + Cloudflare stack. They were captured on August 24, 2026. I am not presenting these settings as a universal recipe—the useful part is seeing how responsibilities are divided between several layers rather than enabling every overlapping optimization option everywhere.
Super Page Cache handles the page-cache layer. Asset CleanUp gives me selective control over frontend assets. Debloat handles additional CSS/JavaScript delivery work where it has proved useful. Cloudflare sits in front of the origin without an indiscriminate cache-everything configuration. Each change is tested against the site as an actual visitor would use it.


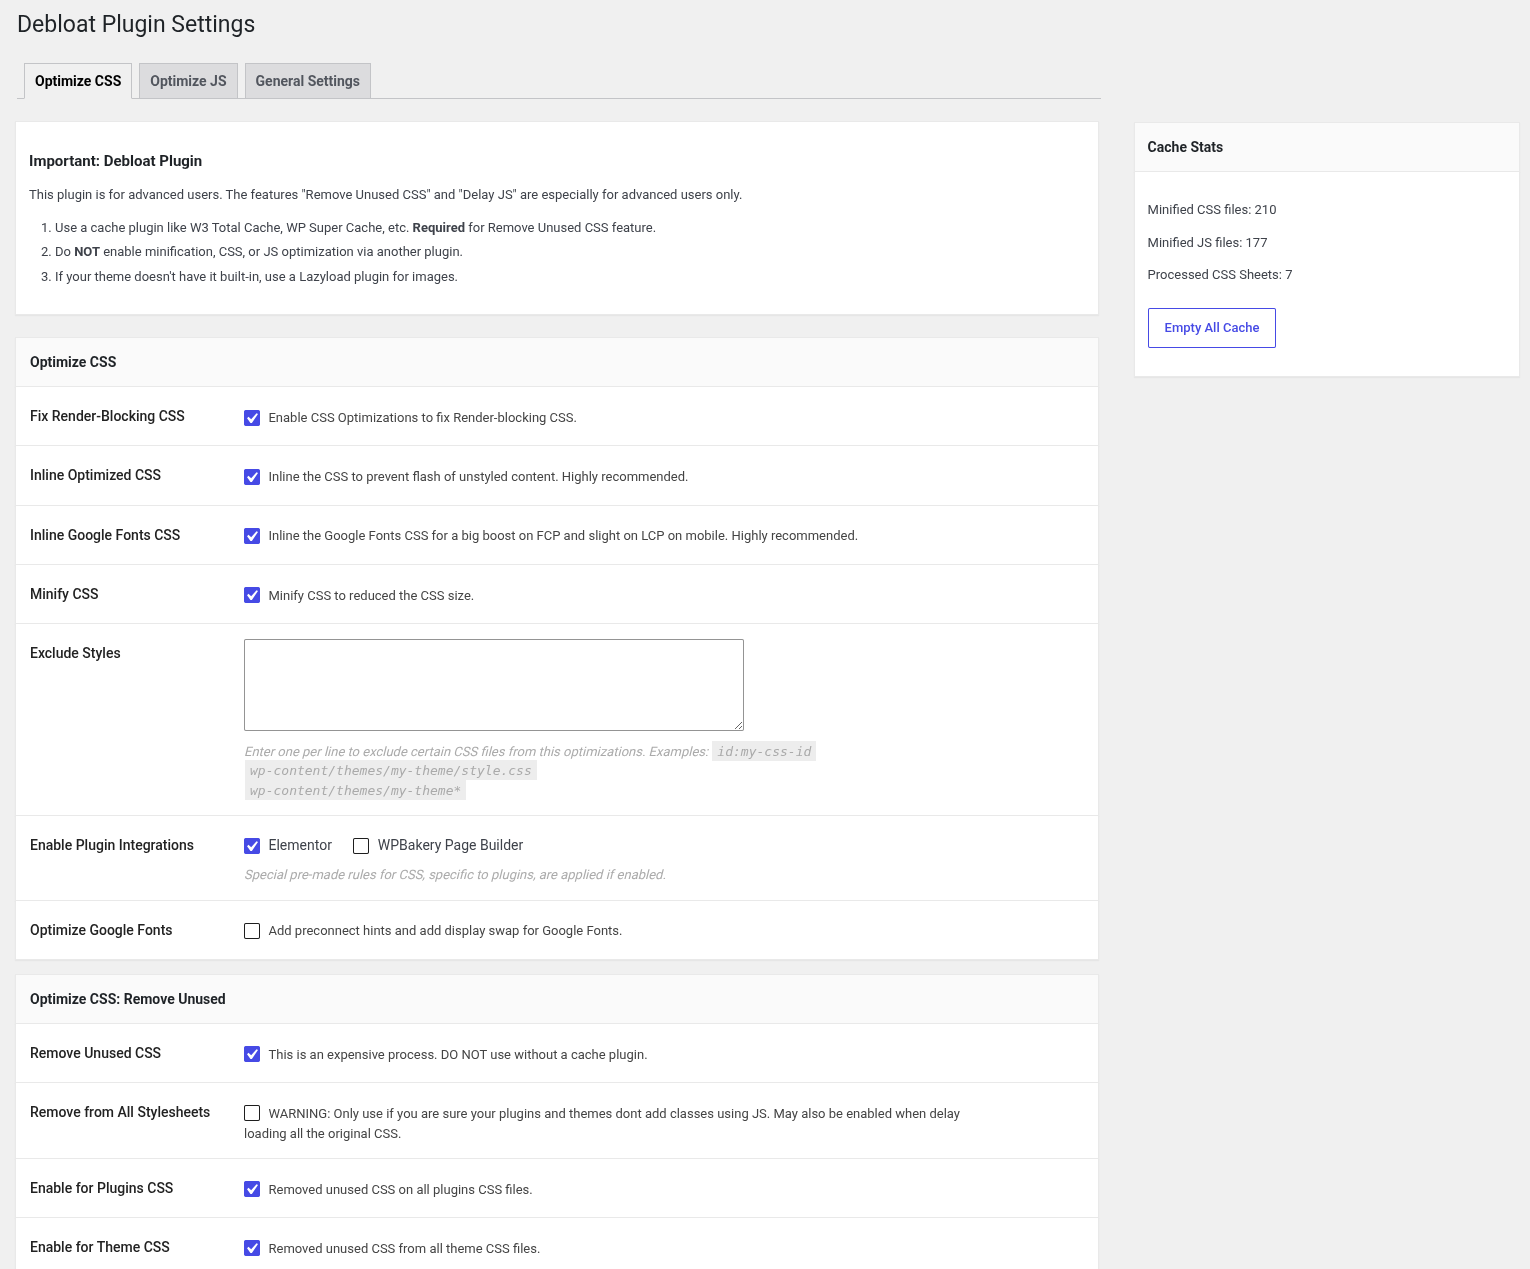
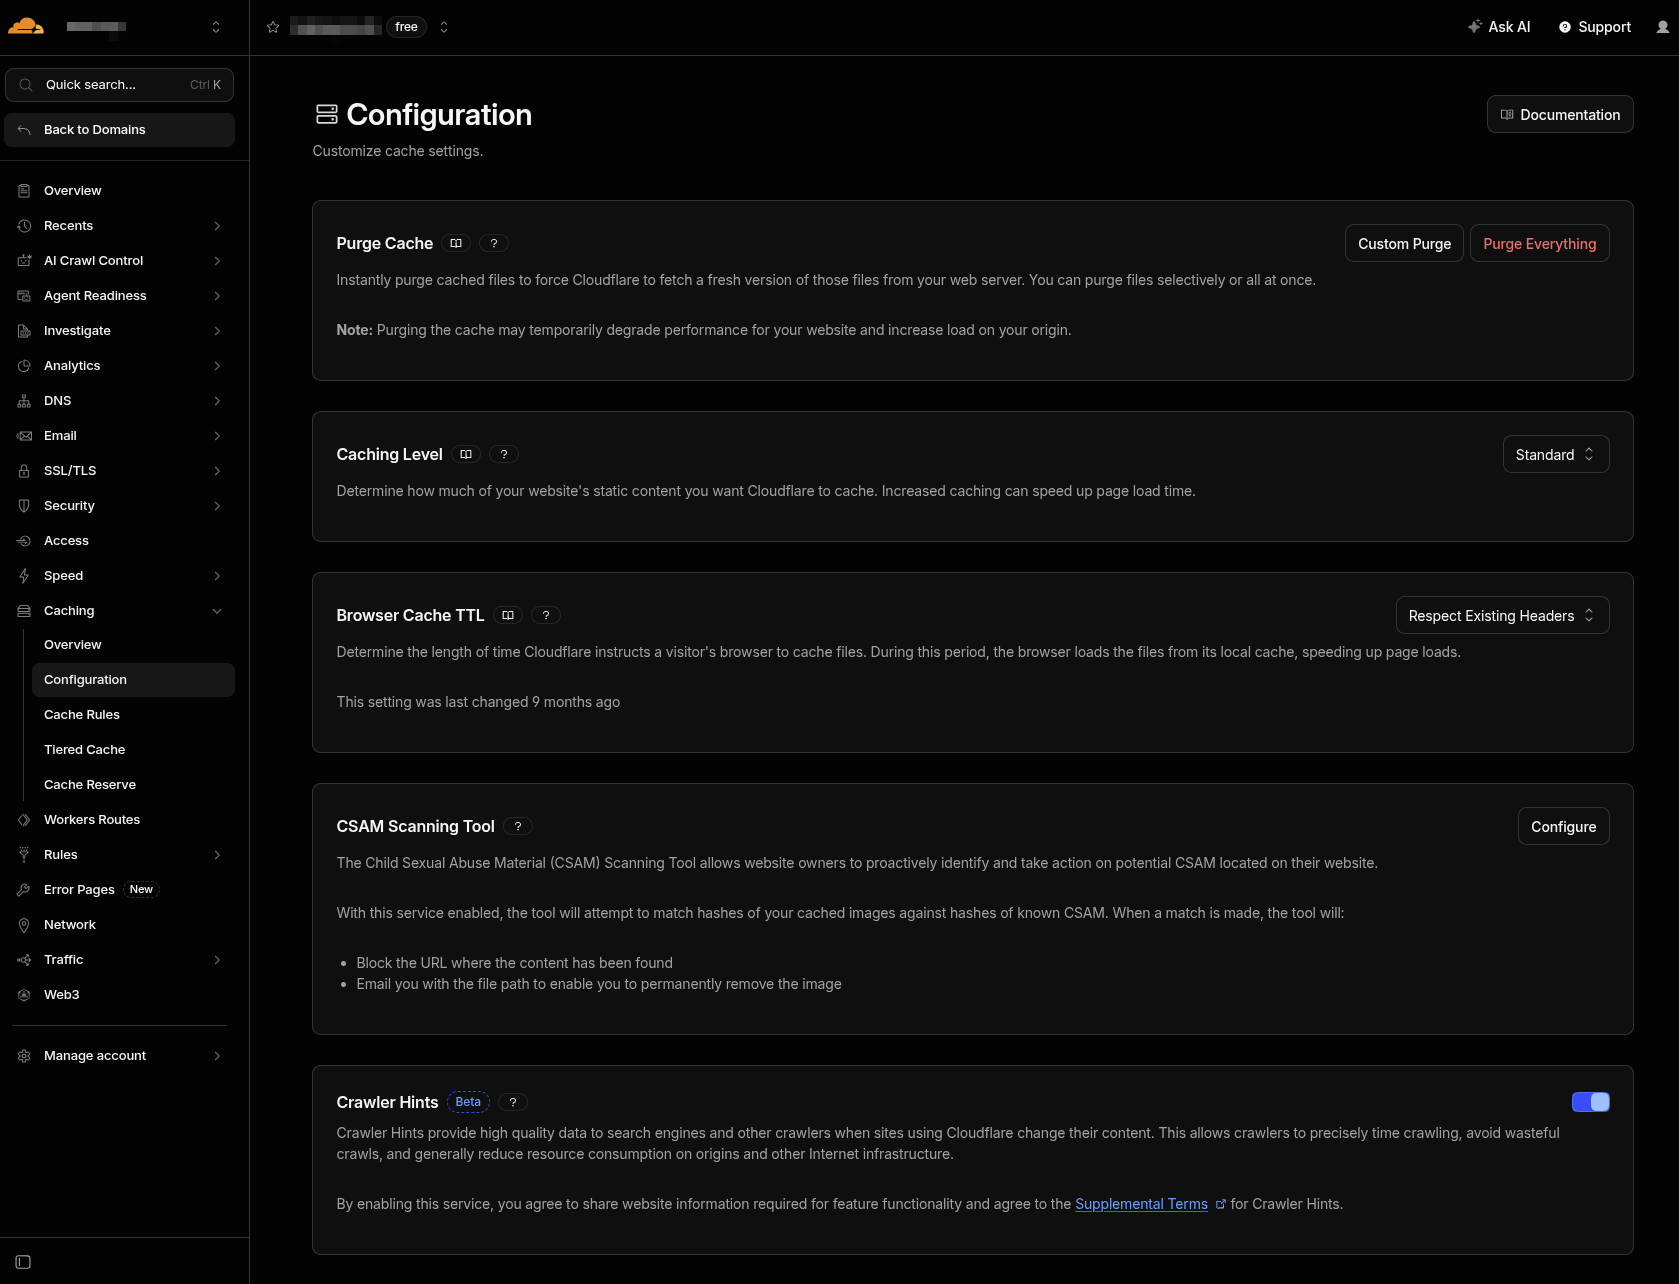
These screenshots show one working configuration at one point in time. They are evidence of how I divide responsibilities in this stack, not settings I would copy blindly onto another WordPress or WooCommerce installation.
External services can quietly dominate response time
Modern ecommerce sites often depend on services outside WordPress.
Examples include:
- payment gateways
- shipping systems
- inventory services
- tax calculation
- CRM systems
- marketing automation
- analytics
- fraud detection
- product feeds
- search services
- affiliate systems
A plugin may appear to be the source of a delay when the real problem is a remote API it calls.
That is why profiling only PHP execution or SQL queries can still miss an important bottleneck.
Network calls should be measured separately.
If an external service occasionally takes three seconds to answer, increasing MySQL's buffer pool will not fix it.
Possible solutions may instead involve:
- caching API responses
- moving work to background jobs
- reducing request frequency
- batching operations
- setting sensible timeouts
- redesigning synchronous workflows
The correct solution depends on whether the remote information is actually required during the visitor's request.
Frontend optimization still matters
Once backend response time is healthy, the browser side deserves the same diagnostic approach.
Typical problems include:
- unnecessarily large images
- poorly sized responsive images
- excessive JavaScript
- render-blocking resources
- large CSS bundles
- unused scripts and styles
- third-party tracking code
- web fonts
- excessive DOM complexity
- layout shifts
- slow external widgets
Modern formats such as WebP and AVIF can substantially reduce image transfer size when used appropriately.
Lazy loading can prevent below-the-fold media from delaying the initial page.
A CDN can place static assets closer to visitors.
But these techniques should complement backend optimization rather than conceal a slow application.
A page with optimized images is still slow if PHP takes four seconds to generate the HTML.
Sometimes the application has simply outgrown the server
Optimization has limits.
A heavily used WooCommerce store performs substantially more work than a small informational WordPress site.
At some point, the existing server may simply lack sufficient resources.
The important distinction is determining whether the site needs more infrastructure after obvious inefficiencies have been identified.
Moving an inefficient application to a larger server often produces an immediate improvement.
It can also become an expensive way of hiding the underlying problem.
Conversely, spending days shaving milliseconds from queries when the server is genuinely exhausted is equally unproductive.
Capacity planning and optimization should support each other.
A practical diagnostic sequence
When I investigate a slow WordPress or WooCommerce installation, I prefer to work through the system in layers.
1. Reproduce the problem
Determine exactly what is slow.
Is it:
- every page
- only WooCommerce pages
- only the administration area
- checkout
- searches
- logged-in sessions
- traffic spikes
- scheduled jobs
- specific times of day
A vague complaint that "the site is slow" needs to become a reproducible event.
2. Establish baseline measurements
Record response times and relevant server metrics before changing anything.
Without a baseline, it is difficult to prove whether a change helped.
3. Separate backend from frontend delay
Determine whether time is being spent before HTML arrives or afterward in the browser.
That immediately narrows the investigation.
4. Inspect resource pressure
Check CPU, memory, swapping, disk I/O and process utilization.
Resource exhaustion often reveals itself quickly once the correct metric is examined.
5. Profile PHP and WordPress
Identify expensive application operations, hooks, plugins and external calls.
6. Inspect database activity
Look for slow or repeated queries, unnecessary database traffic and whether frequently accessed data is being cached effectively.
7. Inspect caching
Determine what is cached at each layer:
- browser
- CDN
- page
- object
- PHP opcode
Do not assume that "caching is enabled" answers this question.
8. Test changes individually
Change one meaningful variable at a time when possible.
Then measure again.
Otherwise it becomes difficult to know which modification produced the result.
9. Load test carefully when necessary
A site that performs well for one visitor may behave very differently under concurrent load.
Testing concurrency can expose exhausted workers, database contention and resource limits that ordinary page testing never reveals.
10. Continue monitoring after the fix
Performance changes as traffic, data and software change.
A solution that works today should still be monitored over time.
The objective is not a perfect score
Performance tools are useful, but their scores should not become the objective.
The objective is a site that responds quickly, behaves correctly and remains stable under the workload it actually receives.
For an ecommerce business, that includes the entire customer journey:
- browsing
- searching
- product pages
- cart operations
- checkout
- payment
- customer accounts
- administration
- integrations
- background processing
A homepage that scores 100 in a synthetic benchmark does not compensate for a checkout process that stalls under load.
A useful result can still be imperfect
The same bakasyon.ph configuration provides a useful example. In a PageSpeed Insights run on August 24, 2026, the desktop test returned a 98 performance score, with a 0.3-second First Contentful Paint, 0.8-second Largest Contentful Paint, 120 ms Total Blocking Time and 0.007 Cumulative Layout Shift.
The mobile test returned 85 performance, with a 1.4-second First Contentful Paint, 3.8-second Largest Contentful Paint, 210 ms Total Blocking Time and zero measured layout shift. PageSpeed reported no real-user field data for the site at the time, so these are synthetic snapshots rather than proof of real-world performance for every visitor.
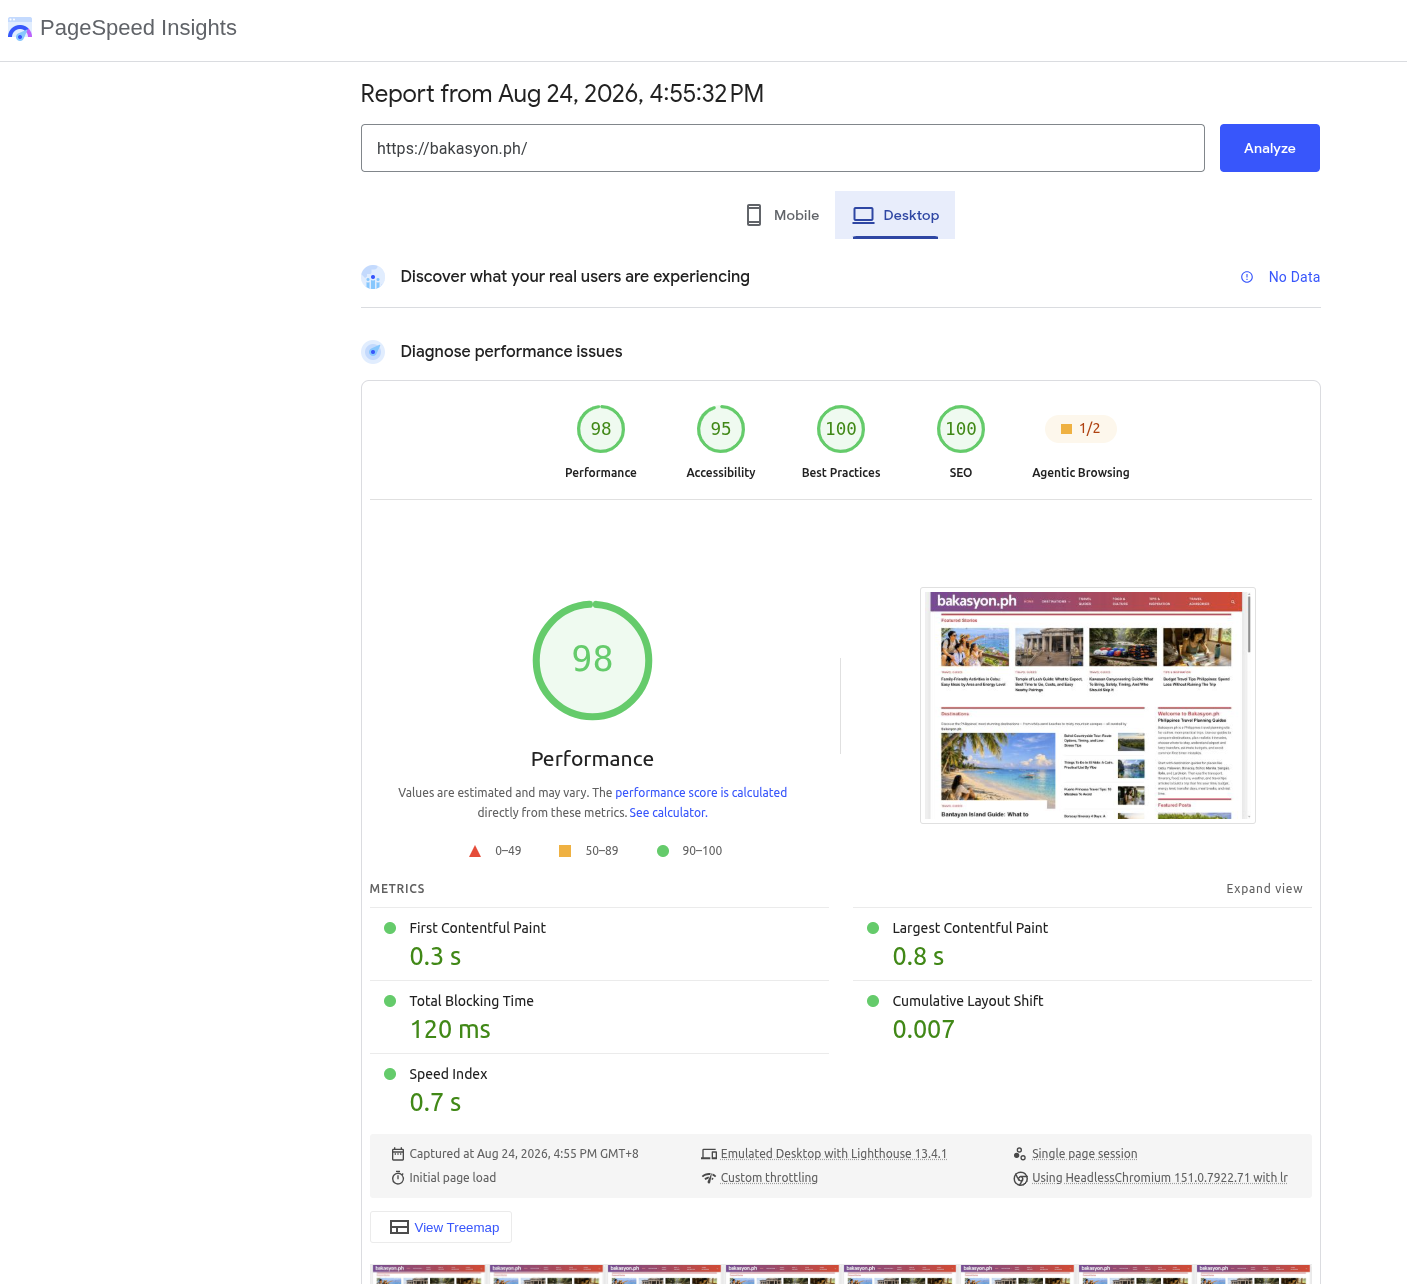
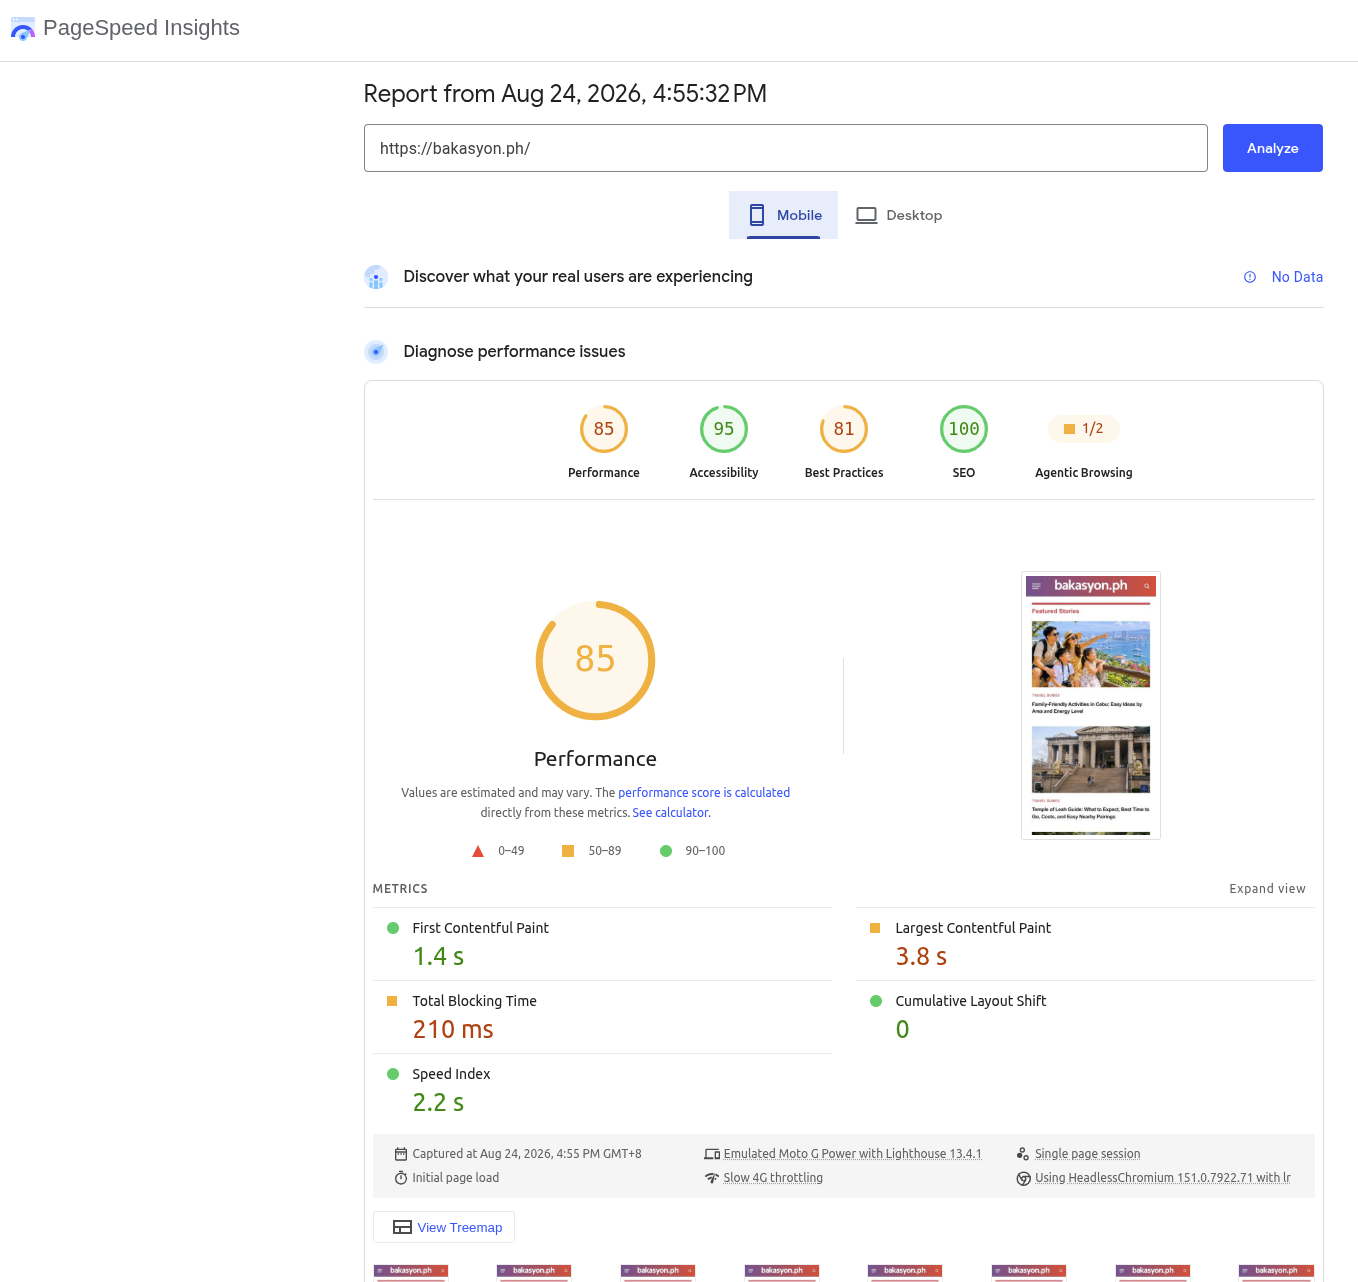
I actually prefer showing both reports rather than presenting a cherry-picked perfect score. The desktop result shows that the stack can perform very well; the mobile result shows why measurement still has to drive the next round of work. Neither report proves that a particular plugin caused the result, and neither replaces real-user monitoring.
Diagnose first, optimize second
WordPress and WooCommerce can support surprisingly substantial workloads when the different layers are configured appropriately.
They can also perform badly on powerful hardware when application behavior, database access, caching and infrastructure are poorly matched.
That is why I treat performance work primarily as diagnosis.
Measure what is happening.
Identify where the request spends its time.
Understand why that work is occurring.
Then optimize the layer responsible.
It is usually faster, safer and ultimately cheaper than guessing.