Some products begin with a market study.
Others begin because operating an existing system becomes painful enough that building a new tool starts to look reasonable.
Slacron belonged to the second category.
At the time, I was operating a large distributed web estate that included more than 800 affiliate sites spread across eight servers. The servers synchronized data between them, while Cloudflare was used at the DNS layer to help distribute traffic.
The infrastructure worked, but observing it was harder than I wanted it to be.
Was every site reachable? Was it reachable from several regions? How quickly was it responding? Was a server under unusual CPU or memory pressure? Was storage running low? If something failed at 3 a.m., who needed to know—and what evidence would they have afterward?
Those questions eventually became a product.
The central application coordinated the system
Slacron ran on a LAMP stack with a central server responsible for the application and customer data.
That server hosted two distinct interfaces:
- the public website describing and selling the monitoring service
- the application subdomain containing the customer dashboard
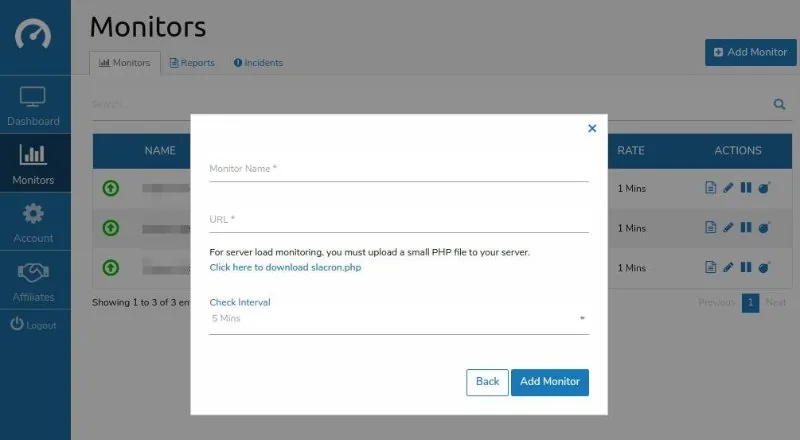
Inside the application, customers could manage subscriptions, users and monitoring configuration. They could create, edit and remove monitors, choose check intervals and decide which users should receive particular alerts.
The central server also stored monitoring results and generated the reporting users saw later.
The design principle was straightforward: coordination stayed centralized, while the checks themselves could be distributed geographically.
A scheduler decided what needed to be checked
Every minute, a cron job on the central system looked for monitoring jobs that were due.
A customer might request checks every minute, every five minutes, every ten minutes or at another configured interval.
The scheduler identified the monitors that should run at that moment and tracked whether results had already been received.
For work that still needed to be performed, the central application dispatched requests to monitoring nodes in other data centers.
This separated two concerns:
- What should be monitored, and when?
- Where should the actual check run?
That separation made it possible to add monitoring locations without duplicating the customer application or account data.
Eight monitoring nodes provided geographic perspective
At its peak, Slacron used eight monitoring servers in different geographic locations.
The coverage included:
- U.S. East Coast
- U.S. West Coast
- central Canada
- two European locations
- two Asian locations
- Australia
Each monitoring server ran the same basic checking code.
This mattered because “the site is up” is not always a global statement.
A service can be reachable from one region while another path is failing. Response time can also vary substantially depending on geography and network conditions.
Running checks from several locations helped distinguish a genuine application outage from a more localized connectivity problem.
Simple checks stayed simple
For ordinary website or service monitoring, the remote node did not need complicated logic.
The monitoring server received a job, performed the requested connection—often using cURL against a configured URL and port—and returned the result to a callback URL on the central server.
Depending on the monitor, the result could include information such as:
- connection success or failure
- HTTP response code
- response time
- returned content
- the monitoring location that performed the check
The central system could then compare the result with the customer's alert conditions.
A non-200 HTTP response, for example, could become an incident depending on how that monitor was configured.
Deeper server monitoring used a lightweight endpoint
Website availability was only part of the problem.
Some customers wanted to know what was happening inside a server as well.
For those monitors, a small PHP component could be installed on the customer's server. The monitoring node could request additional telemetry such as:
- CPU load
- memory usage
- available disk space
- other server-health values supported by the monitor
Those values were returned to the central application through the same general callback model.
I liked this arrangement because the central system did not need direct administrative access to every monitored server. The customer-controlled endpoint exposed only the information the monitoring workflow required.
Results were processed for reporting, not just alerts
A monitoring system becomes much more useful when it remembers what happened.
Additional scheduled processing on the central server prepared incoming results for reporting and historical analysis.
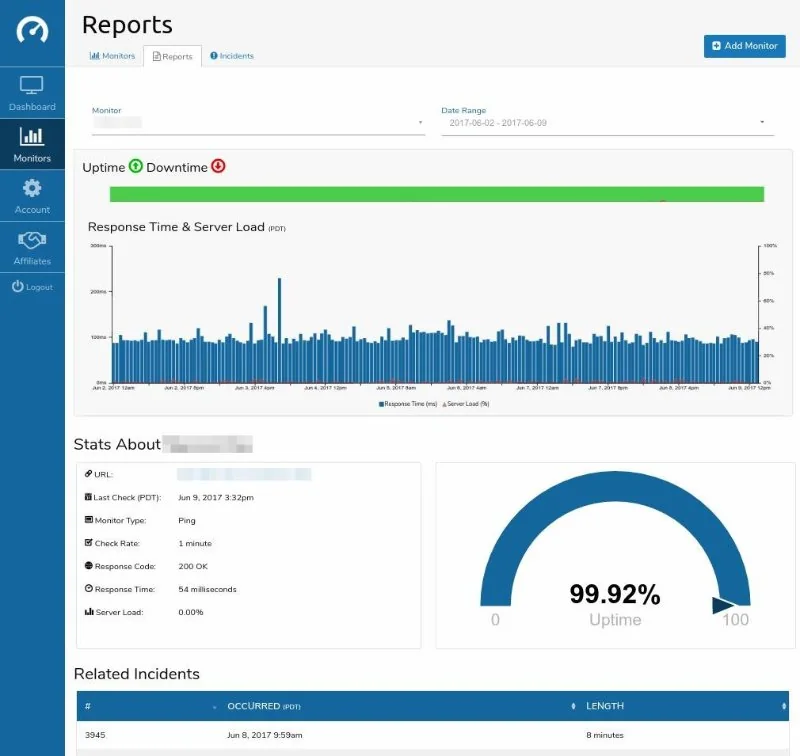
Users could see incident history, availability information, response-time data and reports that were useful beyond the immediate alert.
That became important for customers whose own IT teams had to explain outages internally or document failures involving an ISP or another service provider.
The system was not only asking, “Is this service down right now?”
It was also preserving enough context to answer, “What happened, when did it happen, how long did it last, and what did the monitoring system observe?”
Alerts had to reach the right people
Each customer account could contain multiple users.
Individual users could opt in or out of notifications for different incidents, which mattered in organizations where not every alert belonged to every member of the IT team.
When a configured condition was triggered, the central system could send notifications by email and SMS. Twilio handled most of the SMS delivery.
The notification included a link back to an incident report inside the application.
That detail was important.
An alert that only says DOWN creates urgency but very little context. An alert connected to a report gives the person responding somewhere to begin.
The architecture used callbacks rather than waiting synchronously
The monitoring nodes returned results to callback URLs on the central server.
That meant the central scheduler did not need to sit and wait for every geographic check to complete before moving on.
Conceptually, the flow looked like this:
Scheduler → monitoring node → target service → callback → storage/reporting → alerting
The central system remained the source of truth, while geographically distributed workers performed the network-facing work.
For the scale I needed, this was a relatively simple architecture that separated responsibilities cleanly.
Slacron grew out of operations; CrashSignal started over
Slacron was the product of SLA Monitoring Ltd. I eventually left the company for business reasons unrelated to whether the monitoring service worked.
Later, I built CrashSignal from a new codebase.
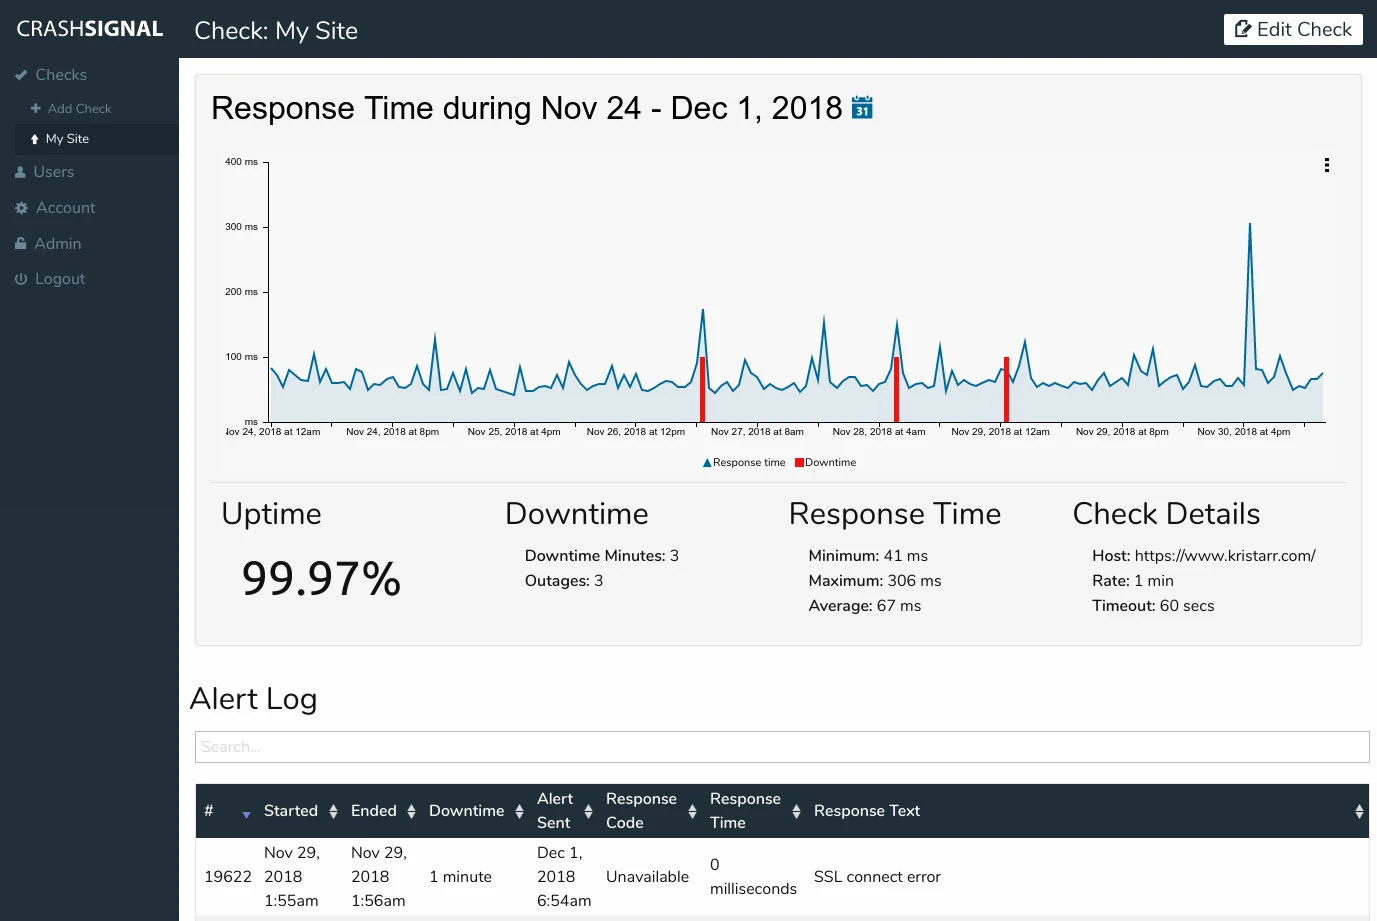
It followed many of the same principles but targeted a different user: people and small organizations that needed monitoring but had little or no budget for it.
CrashSignal was intentionally free.
I had ideas for monetizing the platform later, but my work and life moved in other directions. Instead of turning it into a paid product, I kept the service running for free for years until I no longer had enough time to maintain it properly.
At that point, shutting it down was a better decision than leaving an operational service unattended.
What I learned from building both systems
The most useful lessons were architectural rather than product-specific.
Centralize configuration, distribute observation
Account data, monitor definitions and reporting belonged in one place. Network observations benefited from being geographically distributed.
Keeping those responsibilities separate made the system easier to reason about.
Monitoring location matters
A successful check from one data center does not prove that users everywhere can reach a service.
Geographic diversity adds information, not just redundancy.
Alerts need evidence
The person receiving an alert should not have to begin from zero.
Response codes, timestamps, locations, response times and historical incident data make an alert much more actionable.
Monitoring should understand the service, not only the host
A server can answer a ping while the application is broken.
A web server can return an HTTP response while returning the wrong content.
A site can appear online while the underlying server is running out of disk space.
Useful monitoring therefore needs several layers of observation.
The monitoring system becomes operational infrastructure itself
Once people depend on alerts and reports, the monitoring platform is no longer just a convenience.
It becomes another service that has to be maintained, observed and kept reliable.
That was one reason I eventually retired CrashSignal when I no longer had enough time to give the service the attention it deserved.
The product was really a response to an operational gap
The most important part of the Slacron story is not that I decided to build a monitoring SaaS product.
It is that the product emerged from operating infrastructure where the existing visibility was not good enough.
I needed to know more quickly when systems failed, from where they failed, what the systems returned and what happened over time.
The monitoring platform was the engineering response to that gap.
That pattern has repeated throughout my career: operational problems often become much easier to solve once they are turned into measurable system behavior.